Next-Day Direction Prediction for SPY (Random Forest)
This project is my “first principles” attempt at a classic, high-friction question: can we predict the S&P 500’s next-day move (up/down) using only historical market data and engineered features? I used SPY as the proxy for broad U.S. equity conditions and framed the problem as binary classification (up vs. down), not price regression.
It’s important to be explicit about scope: this is an exploration of signal extraction + evaluation discipline (features, thresholds, rolling backtests), not a claim of market-beating certainty.
- Repo: https://github.com/m-turnergane/stock-predictor-using-randomforest
Why SPY, and why “direction” instead of price?
SPY is liquid, widely followed, and acts as a practical stand-in for the index behavior most people actually interact with.
Predicting the exact next close is usually the wrong target for early experiments. Direction is the simplest “unit test” for:
- whether features encode anything non-trivial
- whether evaluation methodology is honest
- whether a model can produce a selective signal (trade rarely, but with higher confidence)
Model framing
- Target: whether tomorrow's close is higher than today's close (1 = up, 0 = down).
- Model:
RandomForestClassifier - Decisioning: predictions come from
predict_proba, then a threshold converts probability → trade/no-trade signal.
That last piece matters: in markets, how you threshold is often more important than the model choice.
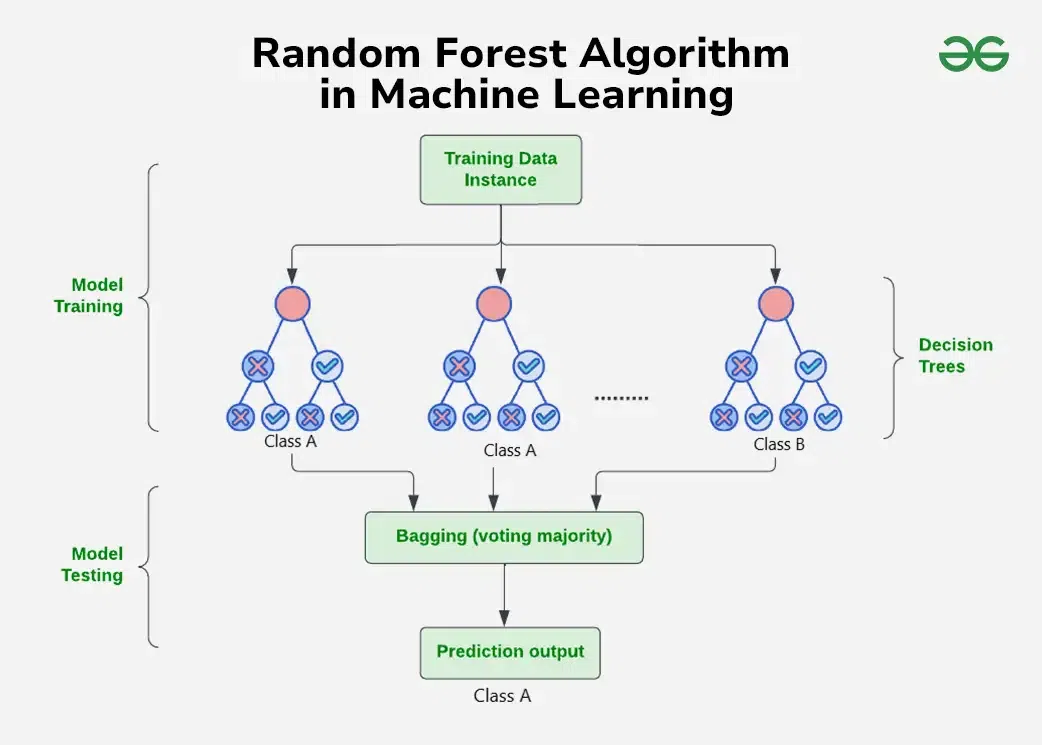 Ensemble of decision trees: each tree votes on up/down, final prediction aggregates across all trees
Data ingestion and persistence
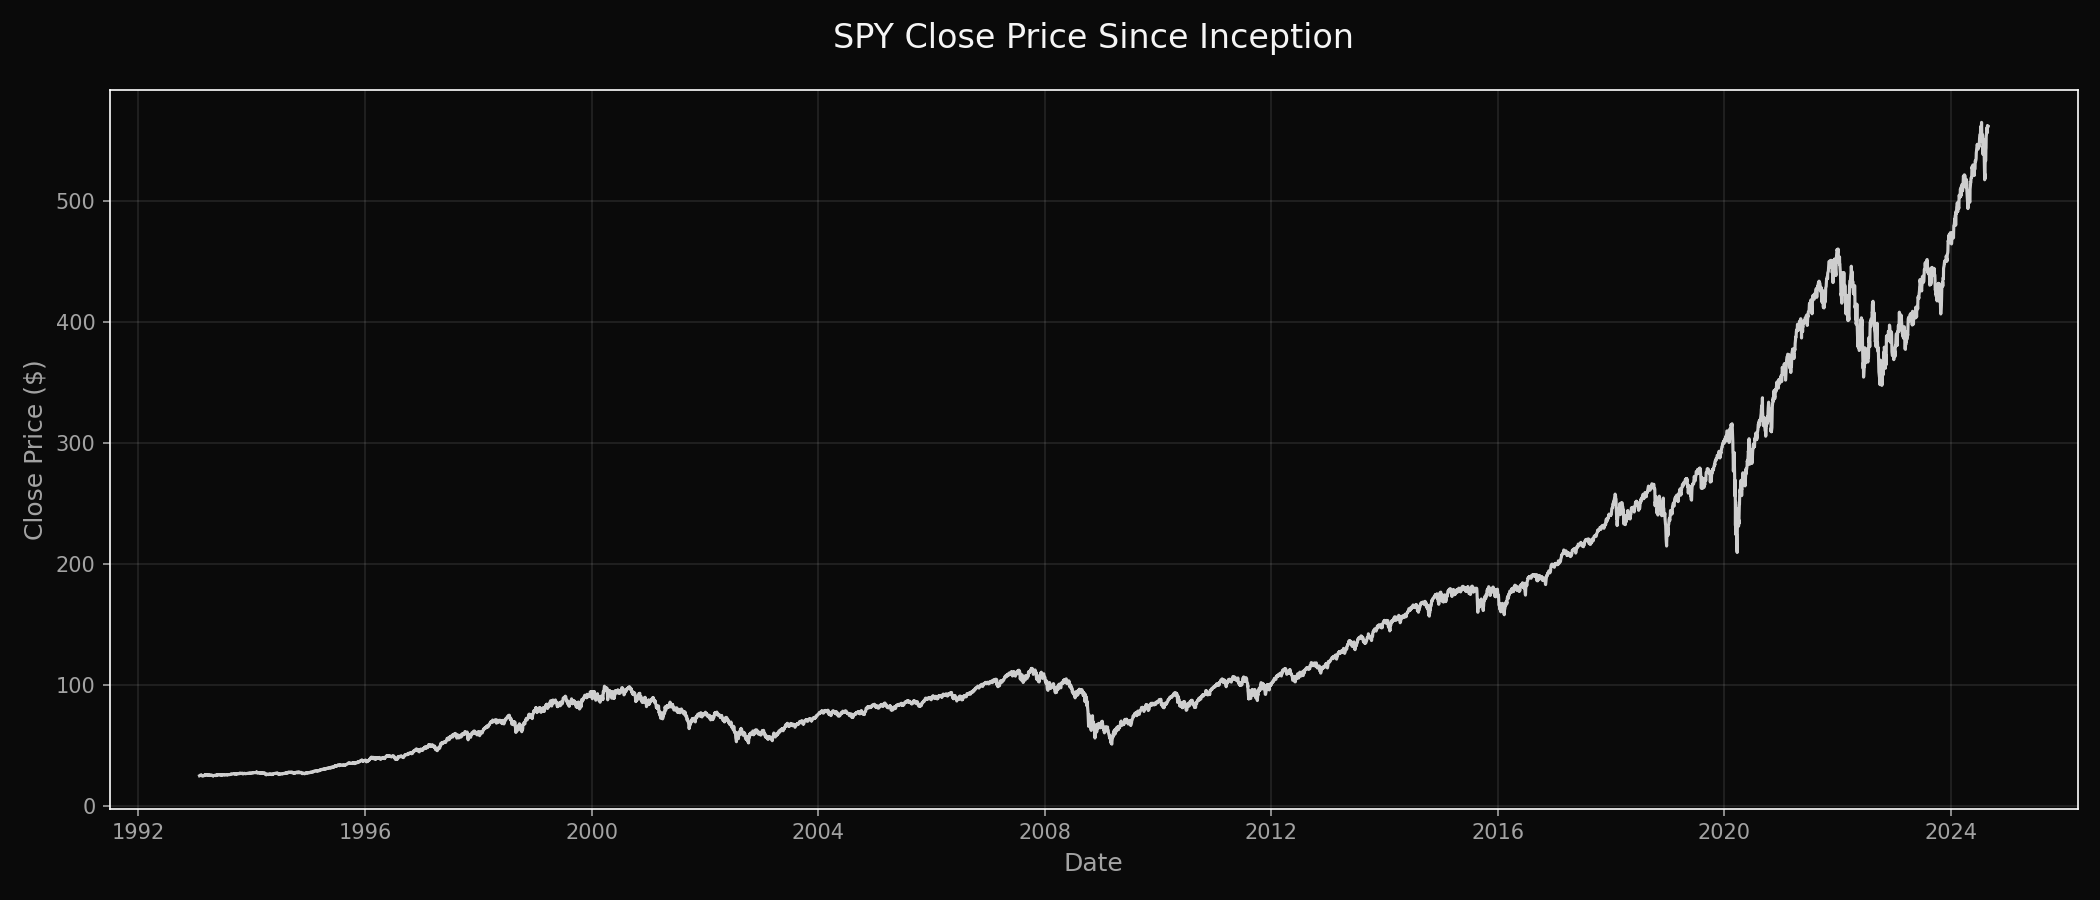
The pipeline starts by downloading SPY’s full available history via yfinance, then caching it locally (e.g., spy.json) to avoid unnecessary repeated pulls.
SPY Since Inception:
- SPY close price since inception (sets context immediately and looks great on-page)
Feature engineering philosophy
The feature set is intentionally "classical technical" and time-local:
1) Rolling context (means and ratios)
- weekly / quarterly / annual rolling means
- ratios between these means and the current close
- ratios between timeframes (e.g., annual vs weekly)
This gives the forest a way to learn regimes like "price extended vs mean," "trend strength," and "relative momentum."
2) Intraday structure
- open/close, high/close, low/close ratios
This approximates daily range, volatility, and position within the candle.
3) Simple momentum proxy
- weekly trend: count of up days in the last week
4) Prior-day values
Joining shifted OHLCV values (*_prev) helps the model reason about change without you explicitly building deltas.
Screenshot of the Dataset values:
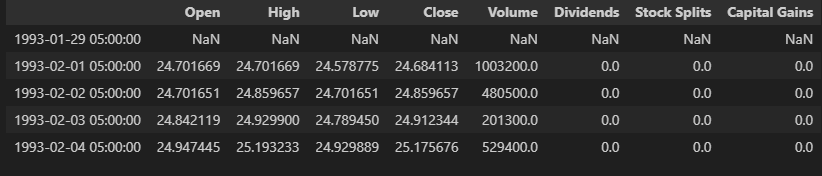 The shifted dataframe head showing prior-day values joined for temporal context
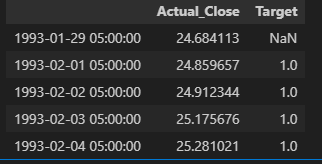 Target column successfully appended: binary classification of next-day direction
Backtesting that respects time
Rather than a random train/test split, I used a rolling-window backtest:
- Train on an expanding (or rolling) historical window
- Test on the next block
- Move forward through time
This is the minimum viable standard for time series ML. It won't eliminate all pitfalls, but it prevents the most common one: leaking the future into the past via shuffling.
Why precision (and why the trade count is low)
I evaluated primarily with precision, not accuracy.
In trading-like settings, especially when thresholding aggressively, you're effectively saying:
"I'd rather act rarely—but when I act, I want to be right more often."
With a higher threshold (e.g., 0.7), the model produces fewer "trade signals," which can inflate precision while lowering recall. That trade-off is not a bug—it's a design choice.
Results and interpretation
The tuning goal was to find a configuration where:
- the model doesn't fire constantly (noise)
- precision rises above "coin flip with confidence"
- predictions are stable enough to inspect and iterate on
The write-up references a modest but meaningful precision improvement after tuning, and a relatively small number of predicted trade events over the full dataset window (i.e., selective signals rather than daily churn).
What matters most here is not a single number—it's whether the methodology produces a framework you can improve without fooling yourself.
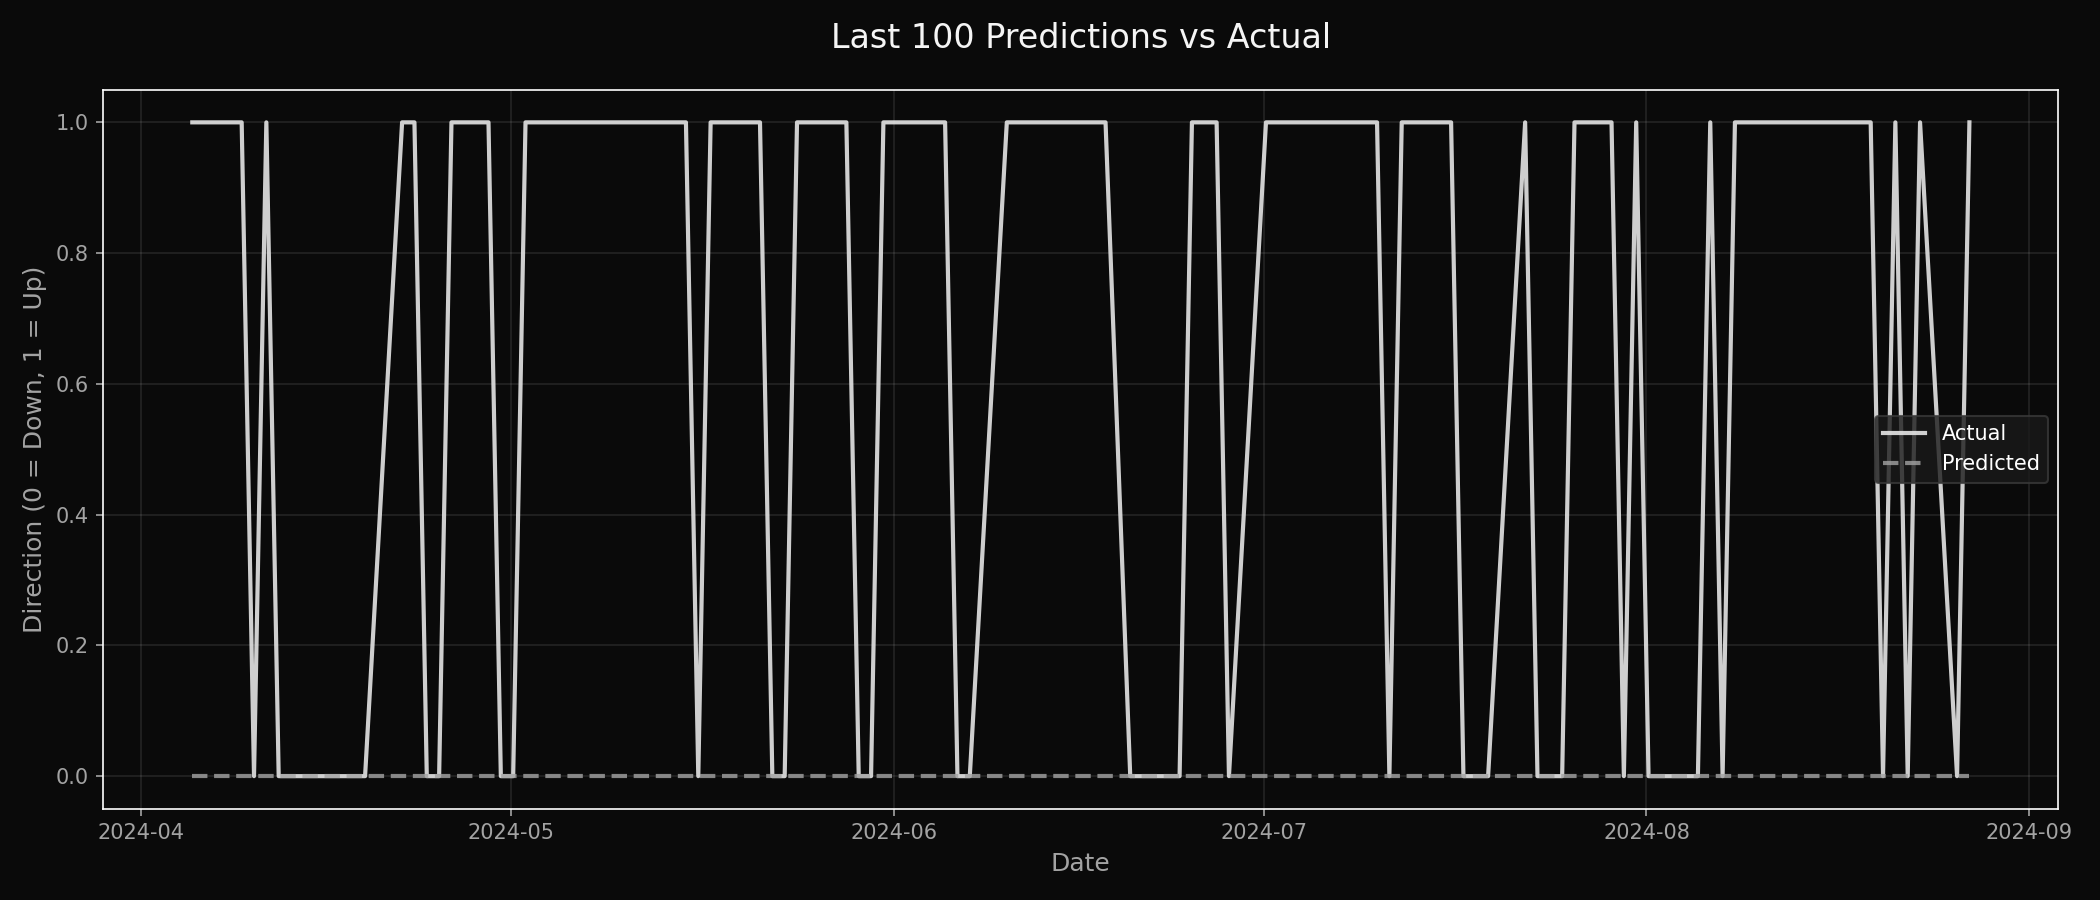 Model predictions vs actual direction over the last 100 data points
What I'd add next
If this were a v2 in the Trading Lab category, I'd add three things that deepen credibility immediately:
1. A threshold sweep chart
Precision / recall (or precision / trade count) as the threshold changes from 0.5 → 0.8.
This shows that your 0.7 choice is principled, not arbitrary.
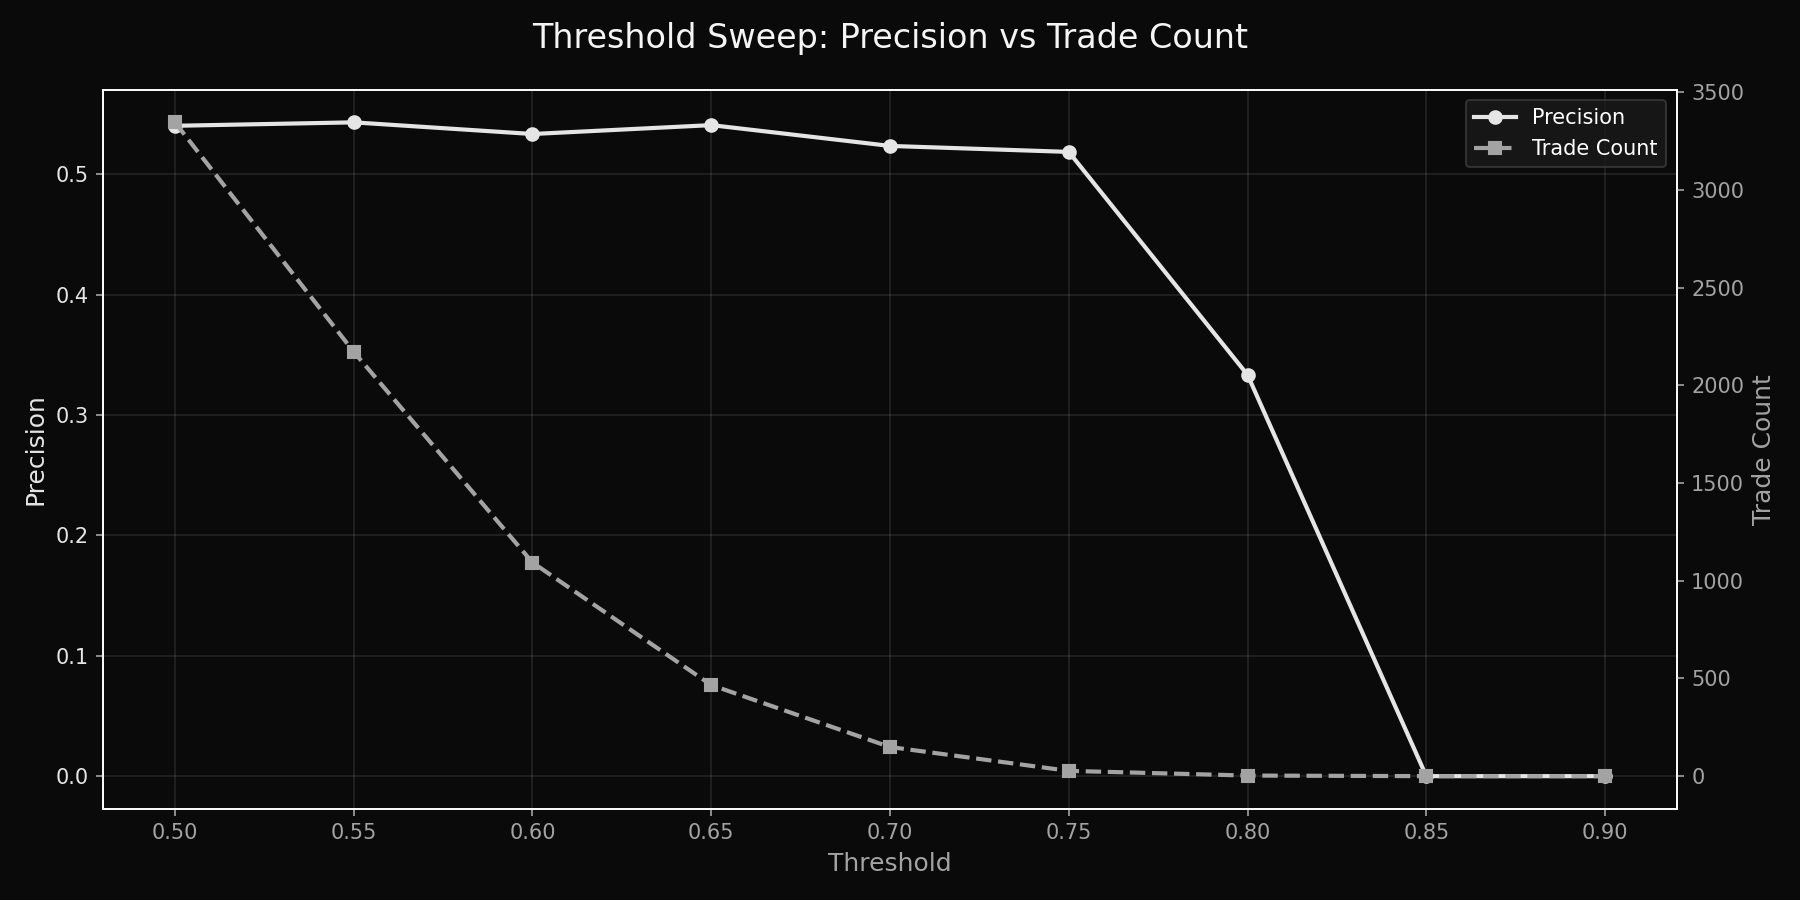 Trade-off curve: as threshold increases, precision rises but trade count drops
2. A confusion matrix + class balance
Especially useful because markets are not perfectly balanced up/down across every regime.
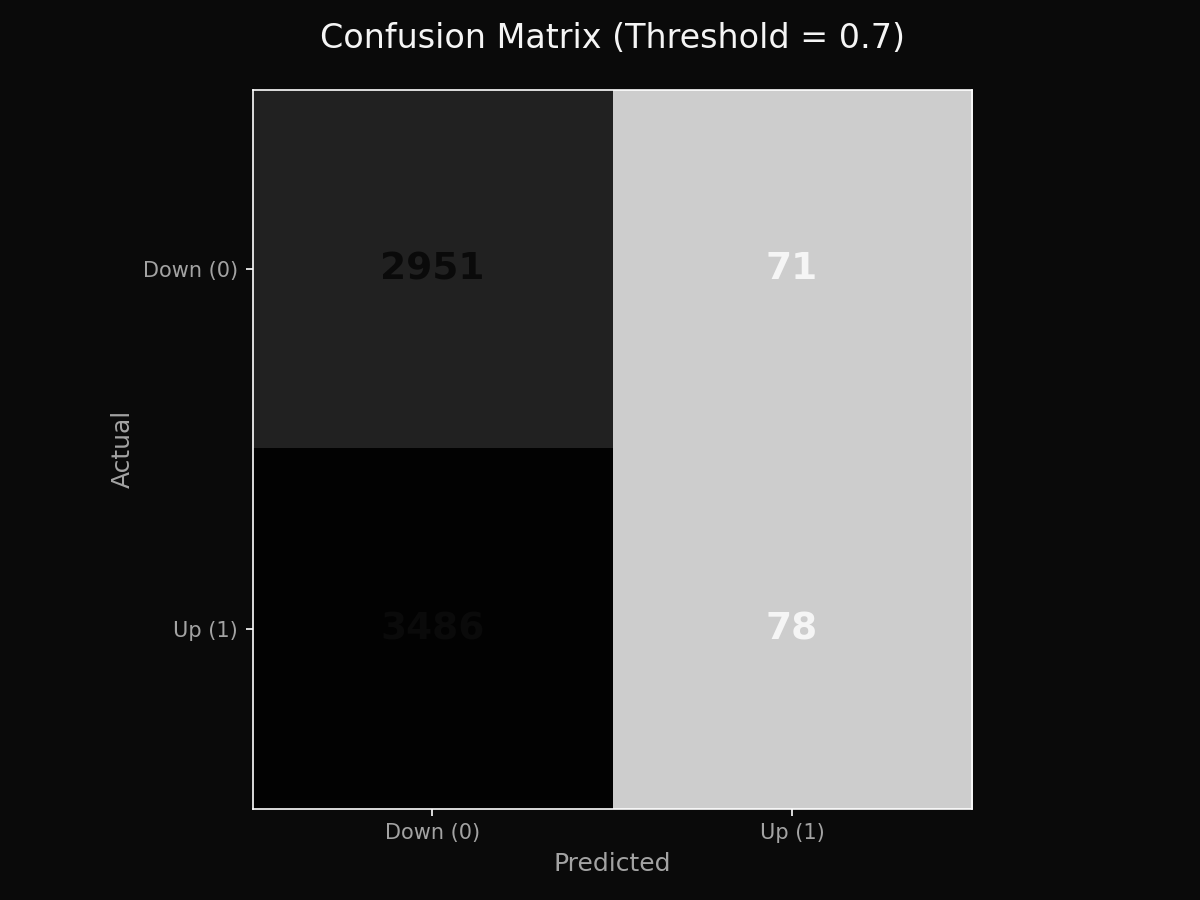 Visual breakdown of true positives, false positives, true negatives, and false negatives
3. Transaction costs + slippage sensitivity
Even a simple "per-trade cost" assumption forces realism.
Optional but high-value:
- Walk-forward parameter stability checks
- Regime segmentation (e.g., pre/post-2008, pre/post-2020)
- Add a small set of extra indicators (RSI/MACD) and compare incremental lift
- Feature importance plot (already easy with RF)
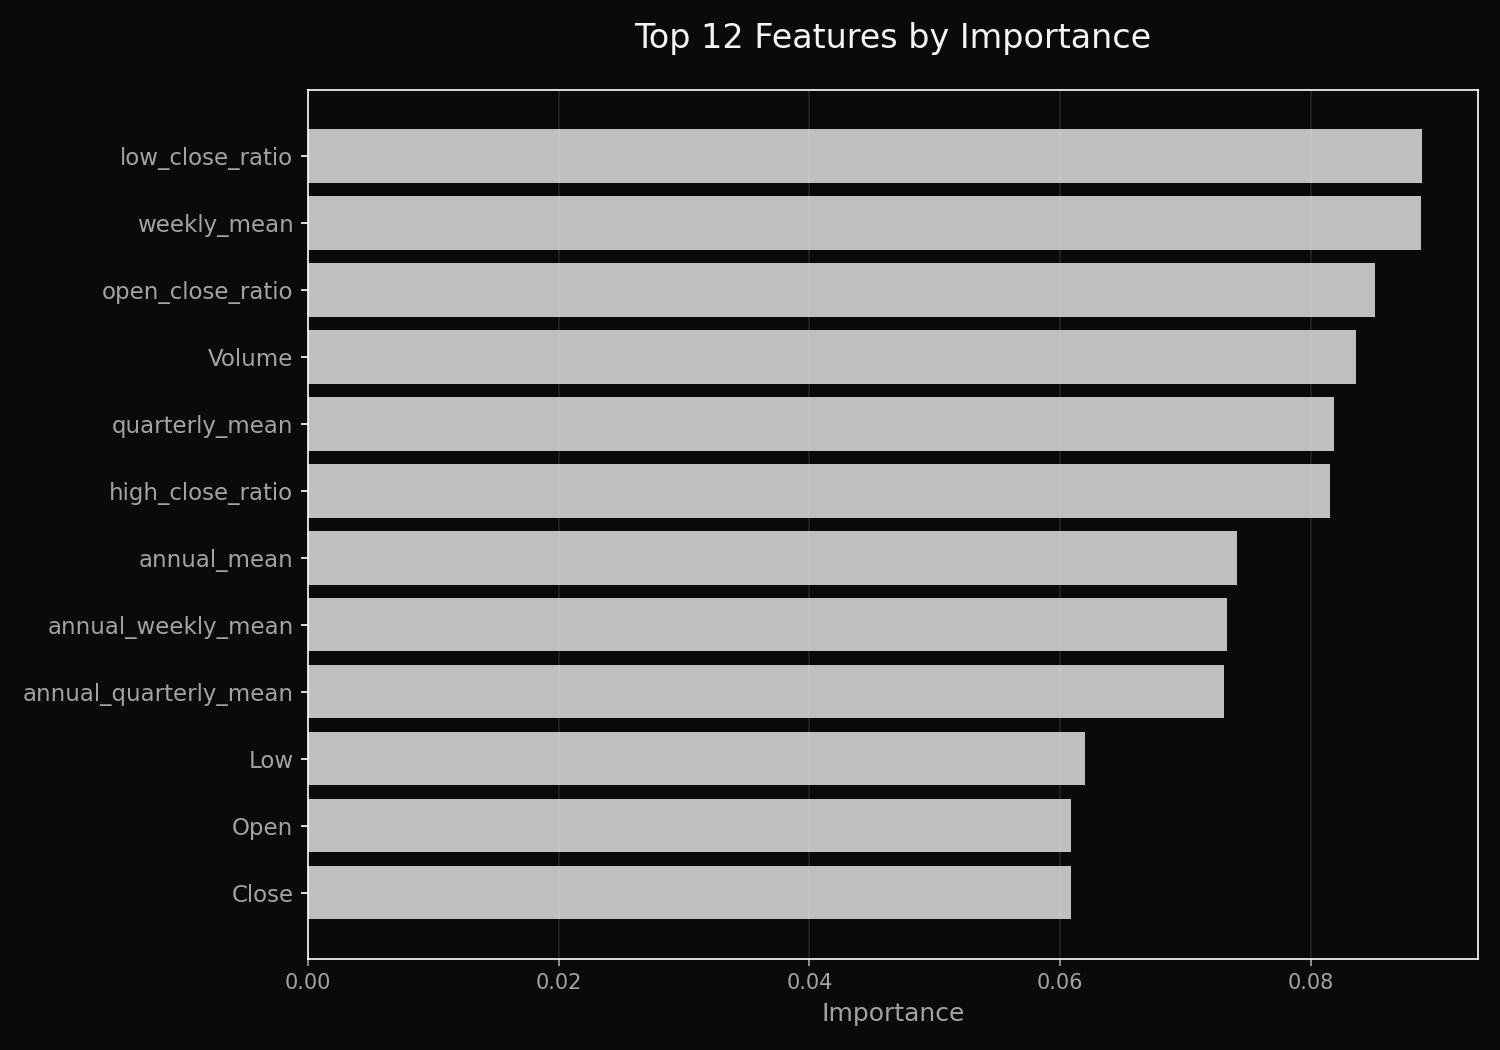 Top 12 features ranked by their contribution to model predictions